The right strategy is crucial for successful reporting.
From sending Excel tables to visualized diagrams in PDF files to state-of-the-art web reporting. I would be happy to advise you on the advantages and disadvantages of the various options.
Demo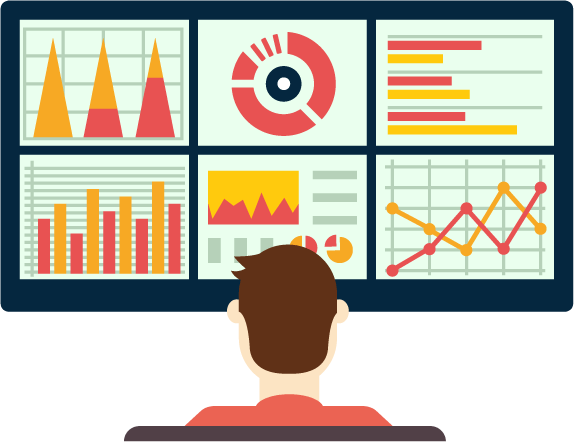
Web reporting
With state-of-the-art dashboards, data can be accessed on any device via the browser.
See example
Excel spreadsheets
Data exchange via Excel tables. I advise in the area of automated data exchange.
See example

Scheduling
I am happy to provide assistance in developing and implementing TWS concepts for automated time-controlled processing.
-

I know the Jedox software. Creation of data cubes, automated data loading and subsequent reporting solution.
-
Over 10 years of experience in dealing with SAP Business Objects. One of the leading business intelligence solutions (BI) for creating professional reports.
-
Matplotlib is a Python library for the so-called "plotting" of data. Large amounts of data are visually displayed using data science.
-
The Python framework used by companies such as Pinterest, Mozilla and Instagram is ideal for web reporting. With django your data is available everywhere and on all devices.
Want to work with me?
Cool! Let’s talk about your project